


red violet Announces First Quarter 2023 Financial Results
First Quarter Revenue Increased 15% to $14.6 Million, Generated EPS of $0.05
BOCA RATON, Fla., May 09, 2023 (GLOBE NEWSWIRE) — Red Violet, Inc. (NASDAQ: RDVT), a leading analytics and information solutions provider, today announced financial results for the quarter ended March 31, 2023.
“Demand for our solutions continues to be strong, and we are pleased to report another quarter of solid performance,” stated Derek Dubner, red violet’s CEO. “Our focus on innovation, customer centricity, and operational efficiency enables us to deliver a distinct value proposition for our customers. We have full confidence in our ability to expand our position in the market while maintaining healthy cash generation and profitability in 2023 and beyond.”
First Quarter Financial Results
For the three months ended March 31, 2023, as compared to the three months ended March 31, 2022:
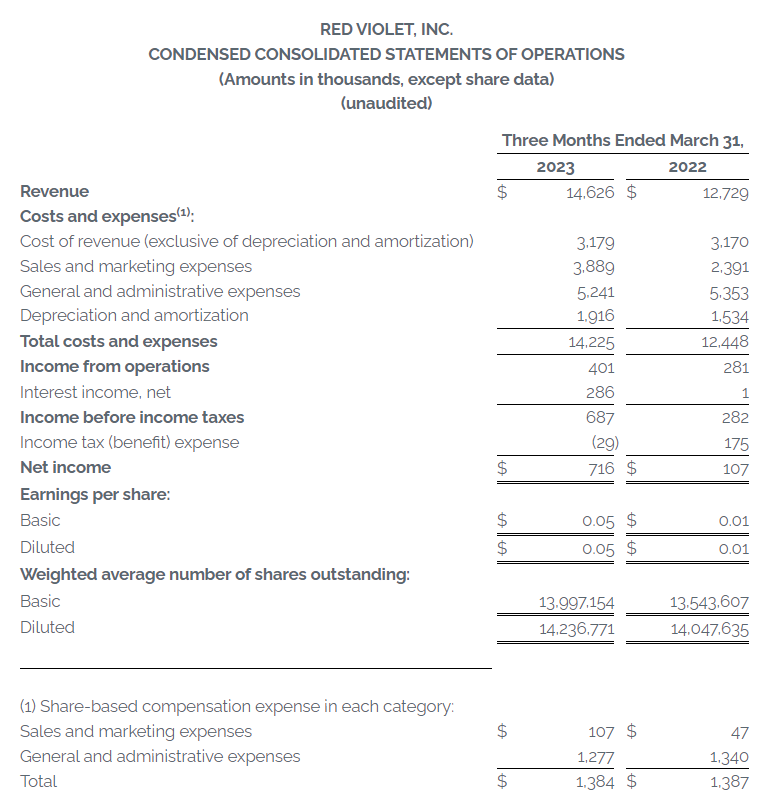
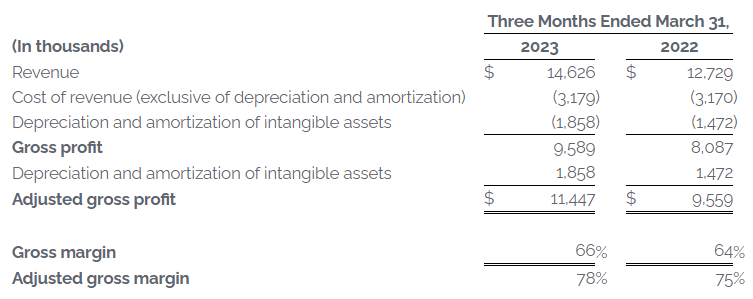
- Total revenue increased 15% to $14.6 million.
- Gross profit increased 19% to $9.6 million. Gross margin increased to 66% from 64%.
- Adjusted gross profit increased 20% to $11.4 million. Adjusted gross margin increased to 78% from 75%.
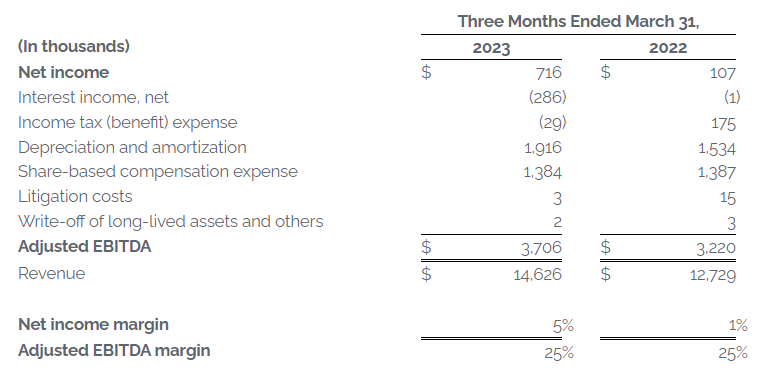
- Net income increased 569% to $0.7 million, which resulted in earnings of $0.05 per basic and diluted share.
- Adjusted EBITDA increased 15% to $3.7 million.
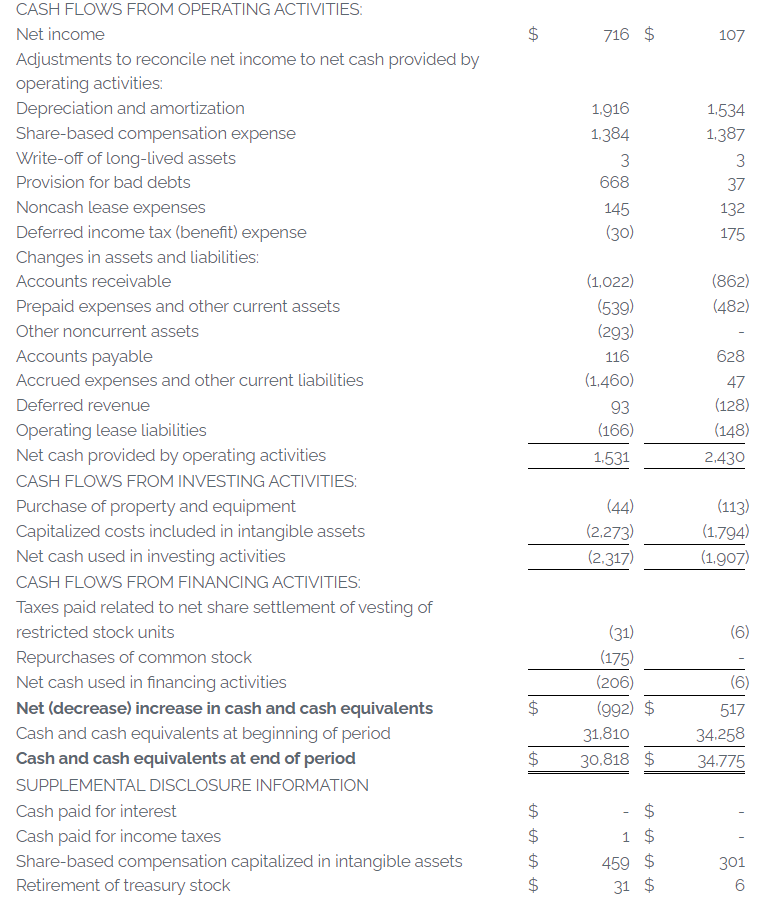
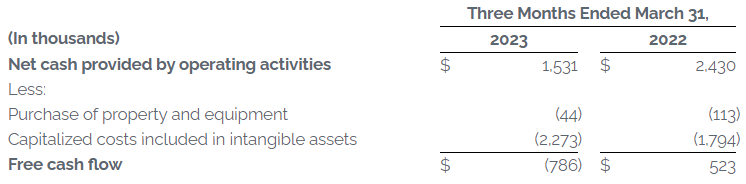
- Net cash from operating activities decreased 37% to $1.5 million.
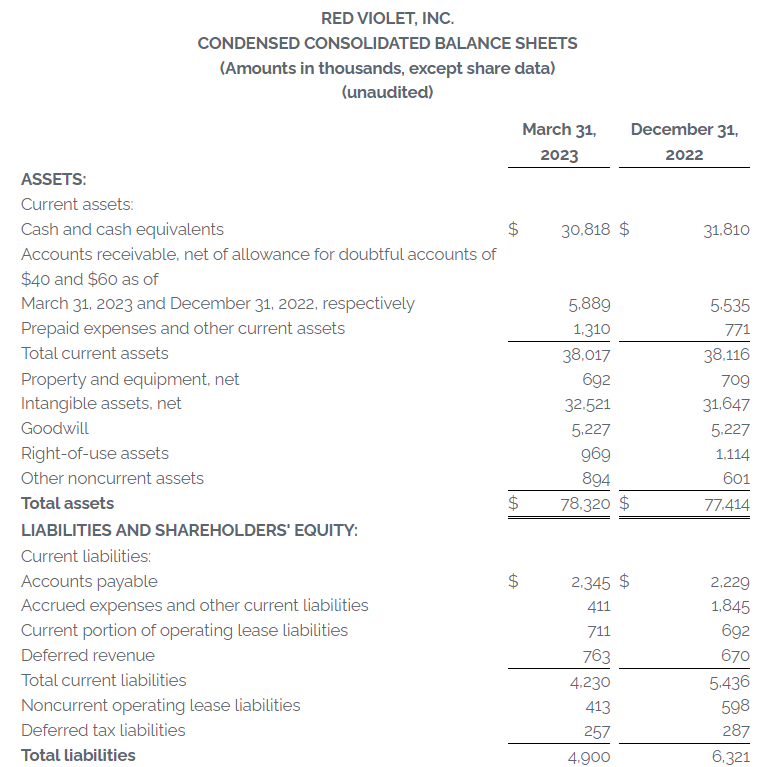
- Cash and cash equivalents were $30.8 million as of March 31, 2023.
First Quarter and Recent Business Highlights
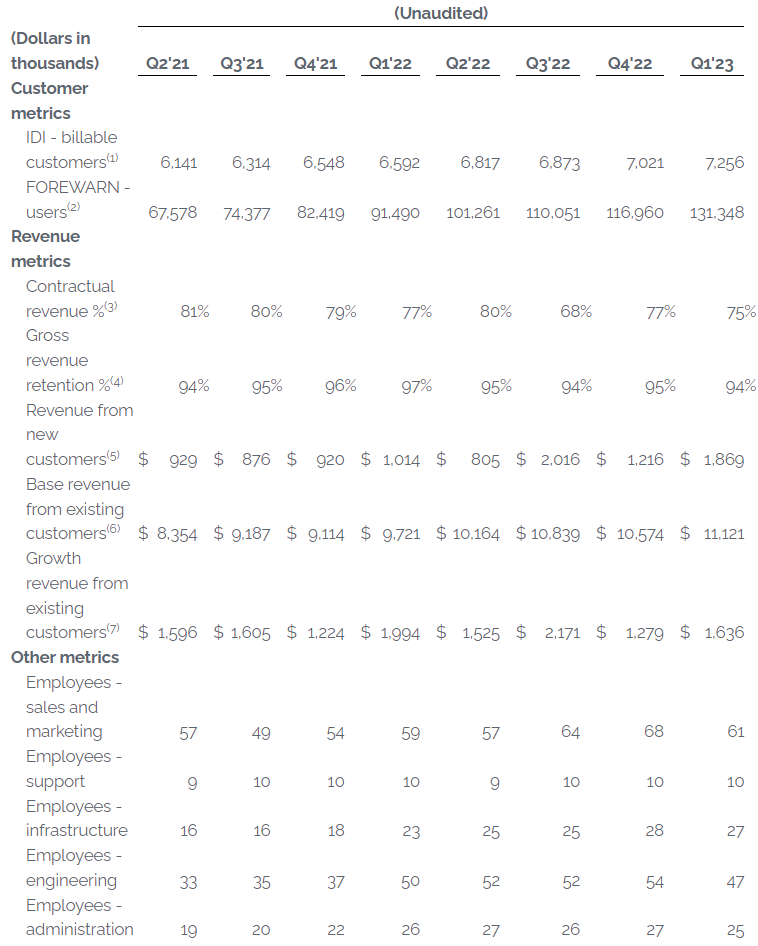
- Added 235 customers to IDI™ during the first quarter, ending the quarter with 7,256 customers.
- Added 14,388 users to FOREWARN® during the first quarter, ending the quarter with 131,348 users. Over 255 REALTOR® Associations throughout the U.S. are now contracted to use FOREWARN.
- Launched redesigned corporate websites, www.redviolet.com, www.ididata.com, and www.forewarn.com, providing a more valuable user experience with modern design, improved functionality, easier navigation, and greater detail on the breadth and applicability of our identity solutions.
- Purchased 44,766 shares of the Company’s common stock year to date through May 5, 2023, at an average price of $16.88 per share pursuant to the Company’s $5.0 million Stock Repurchase Program that was authorized on May 2, 2022. The Company has $3.4 million remaining under the Stock Repurchase Program.
Conference Call
In conjunction with this release, red violet will host a conference call and webcast today at 4:30pm ET to discuss its quarterly and full year results and provide a business update. Please click here to pre-register for the conference call and obtain your dial in number and passcode. To access the live audio webcast, visit the Investors section of the red violet website at www.redviolet.com. Please login at least 15 minutes prior to the start of the call to ensure adequate time for any downloads that may be required. Following the completion of the conference call, an archived webcast of the conference call will be available on the Investors section of the red violet website at www.redviolet.com.
About red violet®
At red violet, we build proprietary technologies and apply analytical capabilities to deliver identity intelligence. Our technology powers critical solutions, which empower organizations to operate with confidence. Our solutions enable the real-time identification and location of people, businesses, assets and their interrelationships. These solutions are used for purposes including risk mitigation, due diligence, fraud detection and prevention, regulatory compliance, and customer acquisition. Our intelligent platform, CORE™, is purpose-built for the enterprise, yet flexible enough for organizations of all sizes, bringing clarity to massive datasets by transforming data into intelligence. Our solutions are used today to enable frictionless commerce, to ensure safety, and to reduce fraud and the concomitant expense borne by society. For more information, please visit www.redviolet.com.
Company Contact:
Camilo Ramirez
Red Violet, Inc.
561-757-4500
ir@redviolet.com
Investor Relations Contacts:
Steven Hooser/Phillip Kupper
Three Part Advisors
214-872-2710
ir@redviolet.com
Use of Non-GAAP Financial Measures
Management evaluates the financial performance of our business on a variety of key indicators, including non-GAAP metrics of adjusted EBITDA, adjusted EBITDA margin, adjusted gross profit, adjusted gross margin and free cash flow (“FCF”). Adjusted EBITDA is a financial measure equal to net income, the most directly comparable financial measure based on US GAAP, excluding interest income, net, income tax (benefit) expense, depreciation and amortization, share-based compensation expense, litigation costs, and write-off of long-lived assets and others. We define adjusted EBITDA margin as adjusted EBITDA as a percentage of revenue. We define adjusted gross profit as revenue less cost of revenue (exclusive of depreciation and amortization), and adjusted gross margin as adjusted gross profit as a percentage of revenue. We define FCF as net cash provided by operating activities reduced by purchase of property and equipment and capitalized costs included in intangible assets.
FORWARD-LOOKING STATEMENTS
This press release contains “forward-looking statements,” as that term is defined under the Private Securities Litigation Reform Act of 1995 (PSLRA), which statements may be identified by words such as “expects,” “plans,” “projects,” “will,” “may,” “anticipate,” “believes,” “should,” “intends,” “estimates,” and other words of similar meaning. Such forward looking statements are subject to risks and uncertainties that are often difficult to predict, are beyond our control and which may cause results to differ materially from expectations, including whether we will be able to expand our position in the market while maintaining healthy cash generation and profitability in 2023 and beyond. Readers are cautioned not to place undue reliance on these forward-looking statements, which are based on our expectations as of the date of this press release and speak only as of the date of this press release and are advised to consider the factors listed above together with the additional factors under the heading “Forward-Looking Statements” and “Risk Factors” in red violet’s Form 10-K for the year ended December 31, 2022 filed on March 8, 2023, as may be supplemented or amended by the Company’s other SEC filings. We undertake no obligation to publicly update or revise any forward-looking statement, whether as a result of new information, future events or otherwise, except as required by law.

Use and Reconciliation of Non-GAAP Financial Measures
Management evaluates the financial performance of our business on a variety of key indicators, including non-GAAP metrics of adjusted EBITDA, adjusted EBITDA margin, adjusted gross profit, adjusted gross margin and FCF. Adjusted EBITDA is a financial measure equal to net income, the most directly comparable financial measure based on GAAP, excluding interest income, net, income tax (benefit) expense, depreciation and amortization, share-based compensation expense, litigation costs, and write-off of long-lived assets and others, as noted in the tables below. We define adjusted EBITDA margin as adjusted EBITDA as a percentage of revenue. We define adjusted gross profit as revenue less cost of revenue (exclusive of depreciation and amortization), and adjusted gross margin as adjusted gross profit as a percentage of revenue. We define FCF as net cash provided by operating activities reduced by purchase of property and equipment and capitalized costs included in intangible assets.
The following is a reconciliation of gross profit, the most directly comparable GAAP financial measure, to adjusted gross profit:
The following is a reconciliation of net cash provided by operating activities, the most directly comparable US GAAP measure, to FCF:
In order to assist readers of our condensed consolidated financial statements in understanding the operating results that management uses to evaluate the business and for financial planning purposes, we present non-GAAP measures of adjusted EBITDA, adjusted EBITDA margin, adjusted gross profit, adjusted gross margin and FCF as supplemental measures of our operating performance. We believe they provide useful information to our investors as they eliminate the impact of certain items that we do not consider indicative of our cash operations and ongoing operating performance. In addition, we use them as an integral part of our internal reporting to measure the performance and operating strength of our business.
We believe adjusted EBITDA, adjusted EBITDA margin, adjusted gross profit, adjusted gross margin and FCF are relevant and provide useful information frequently used by securities analysts, investors and other interested parties in their evaluation of the operating performance of companies similar to ours and are indicators of the operational strength of our business. We believe adjusted EBITDA eliminates the uneven effect of considerable amounts of non-cash depreciation and amortization, share-based compensation expense and the impact of other non-recurring items, providing useful comparisons versus prior periods or forecasts. Adjusted EBITDA margin is calculated as adjusted EBITDA as a percentage of revenue. Our adjusted gross profit is a measure used by management in evaluating the business’ current operating performance by excluding the impact of prior historical costs of assets that are expensed systematically and allocated over the estimated useful lives of the assets, which may not be indicative of the current operating activity. Our adjusted gross profit is calculated by using revenue, less cost of revenue (exclusive of depreciation and amortization). We believe adjusted gross profit provides useful information to our investors by eliminating the impact of non-cash depreciation and amortization, and specifically the amortization of software developed for internal use, providing a baseline of our core operating results that allow for analyzing trends in our underlying business consistently over multiple periods. Adjusted gross margin is calculated as adjusted gross profit as a percentage of revenue. We believe FCF is an important liquidity measure of the cash that is available, after capital expenditures, for operational expenses and investment in our business. FCF is a measure used by management to understand and evaluate the business’s operating performance and trends over time. FCF is calculated by using net cash provided by operating activities, less purchase of property and equipment and capitalized costs included in intangible assets.
Adjusted EBITDA, adjusted EBITDA margin, adjusted gross profit, adjusted gross margin and FCF are not intended to be performance measures that should be regarded as an alternative to, or more meaningful than, financial measures presented in accordance with US GAAP. In addition, FCF is not intended to represent our residual cash flow available for discretionary expenses and is not necessarily a measure of our ability to fund our cash needs. The way we measure adjusted EBITDA, adjusted EBITDA margin, adjusted gross profit, adjusted gross margin and FCF may not be comparable to similarly titled measures presented by other companies, and may not be identical to corresponding measures used in our various agreements.
SUPPLEMENTAL METRICS
The following metrics are intended as a supplement to the financial statements found in this release and other information furnished or filed with the SEC. These supplemental metrics are not necessarily derived from any underlying financial statement amounts. We believe these supplemental metrics help investors understand trends within our business and evaluate the performance of such trends quickly and effectively. In the event of discrepancies between amounts in these tables and the Company’s historical disclosures or financial statements, readers should rely on the Company’s filings with the SEC and financial statements in the Company’s most recent earnings release.
We intend to periodically review and refine the definition, methodology and appropriateness of each of these supplemental metrics. As a result, metrics are subject to removal and/or changes, and such changes could be material.
(1) We define a billable customer of IDI as a single entity that generated revenue in the last three months of the period. Billable customers are typically corporate organizations. In most cases, corporate organizations will have multiple users and/or departments purchasing our solutions, however, we count the entire organization as a discrete customer.
(2) We define a user of FOREWARN as a unique person that has a subscription to use the FOREWARN service as of the last day of the period. A unique person can only have one user account.
(3) Contractual revenue % represents revenue generated from customers pursuant to pricing contracts containing a monthly fee and any additional overage divided by total revenue. Pricing contracts are generally annual contracts or longer, with auto renewal.
(4) Gross revenue retention is defined as the revenue retained from existing customers, net of reinstated revenue, and excluding expansion revenue. Revenue is measured once a customer has generated revenue for six consecutive months. Revenue is considered lost when all revenue from a customer ceases for three consecutive months; revenue generated by a customer after the three-month loss period is defined as reinstated revenue. Gross revenue retention percentage is calculated on a trailing twelve-month basis. The numerator of which is revenue lost during the period due to attrition, net of reinstated revenue, and the denominator of which is total revenue based on an average of total revenue at the beginning of each month during the period, with the quotient subtracted from one. Prior to Q1’22, FOREWARN revenue was excluded from our gross revenue retention calculation. Beginning Q4’22, our gross revenue retention calculation excludes revenue from idiVERIFIED, which is purely transactional and currently represents less than 3% of total revenue.
(5) Revenue from new customers represents the total monthly revenue generated from new customers in a given period. A customer is defined as a new customer during the first six months of revenue generation.
(6) Base revenue from existing customers represents the total monthly revenue generated from existing customers in a given period that does not exceed the customers’ trailing six-month average revenue. A customer is defined as an existing customer six months after their initial month of revenue.
(7) Growth revenue from existing customers represents the total monthly revenue generated from existing customers in a given period in excess of the customers’ trailing six-month average revenue.