


red violet Announces Fourth Quarter and Full Year 2019 Financial Results
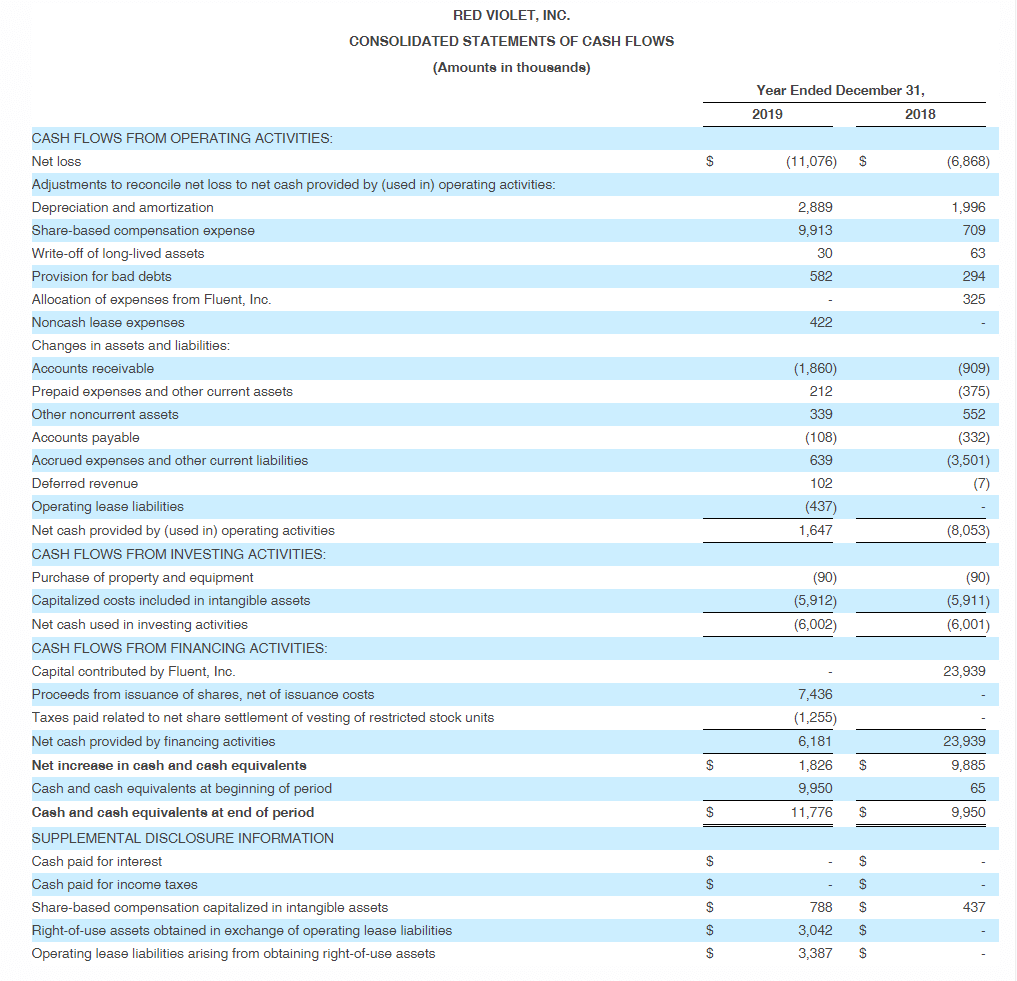
Revenue Increases 92% to $9.1 Million Generating $1.2 Million in Cash from Operating Activities in the Fourth Quarter
BOCA RATON, Fla.–(BUSINESS WIRE)–Red Violet, Inc. (NASDAQ: RDVT), a leading analytics and information solutions provider, today announced financial results for the quarter and full year ended December 31, 2019.
“Bucking the trend in what is historically a seasonally slower quarter for our business, we capped off a spectacular year, generating record revenue and cash from operations,” stated Derek Dubner, red violet’s CEO. “Leveraging our cloud-native platform, we continue to see larger customers take advantage of the platform’s speed, flexibility and efficiency to grow their businesses, as demonstrated by our 100% increase in revenue from existing customers in 2019. We are winning head-to-head against the competition, led by innovation, next-generation technology, and our relentless focus on driving customer-centric solutions into the marketplace, which continues to fuel our growth. We kicked off 2020 in strong fashion, with solid revenue growth and adjusted EBITDA pacing towards $2 million for Q1 of 2020, which would exceed our adjusted EBITDA for the entire year of 2019. We have never been better positioned for the future than we are today.”
Fourth Quarter Financial Results
For the three months ended December 31, 2019 as compared to the three months ended December 31, 2018:
- Total revenue increased 92% to $9.1 million.
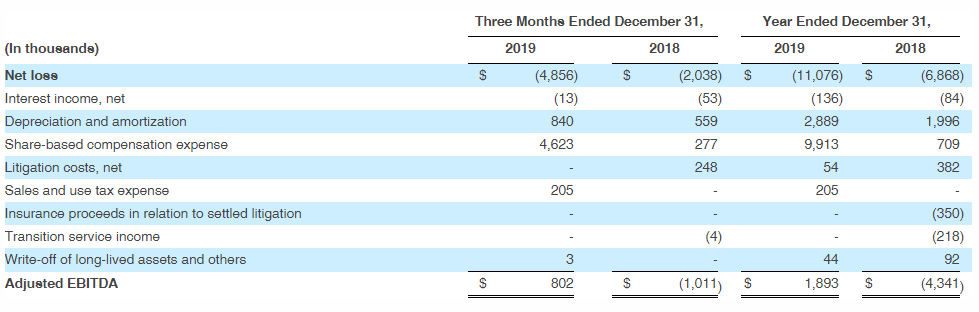
- Net loss was $4.9 million (including share-based compensation expense of $4.6 million, which includes a one-time $2.3 million) as compared to $2.0 million (including share-based compensation expense of $0.3 million).
- Adjusted EBITDA was $0.8 million as compared to a negative $1.0 million.
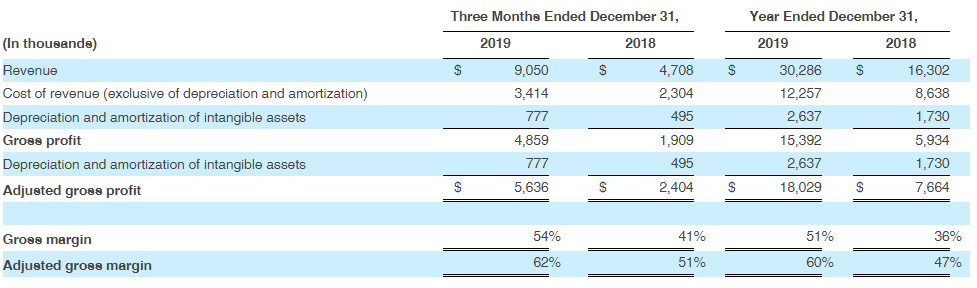
- Gross profit increased 155% to $4.9 million. Gross margin increased to 54% from 41%.
- Adjusted gross profit increased 134% to $5.6 million. Adjusted gross margin increased to 62% from 51%.
Full Year Financial Results
For the year ended December 31, 2019 as compared to the year ended December 31, 2018:
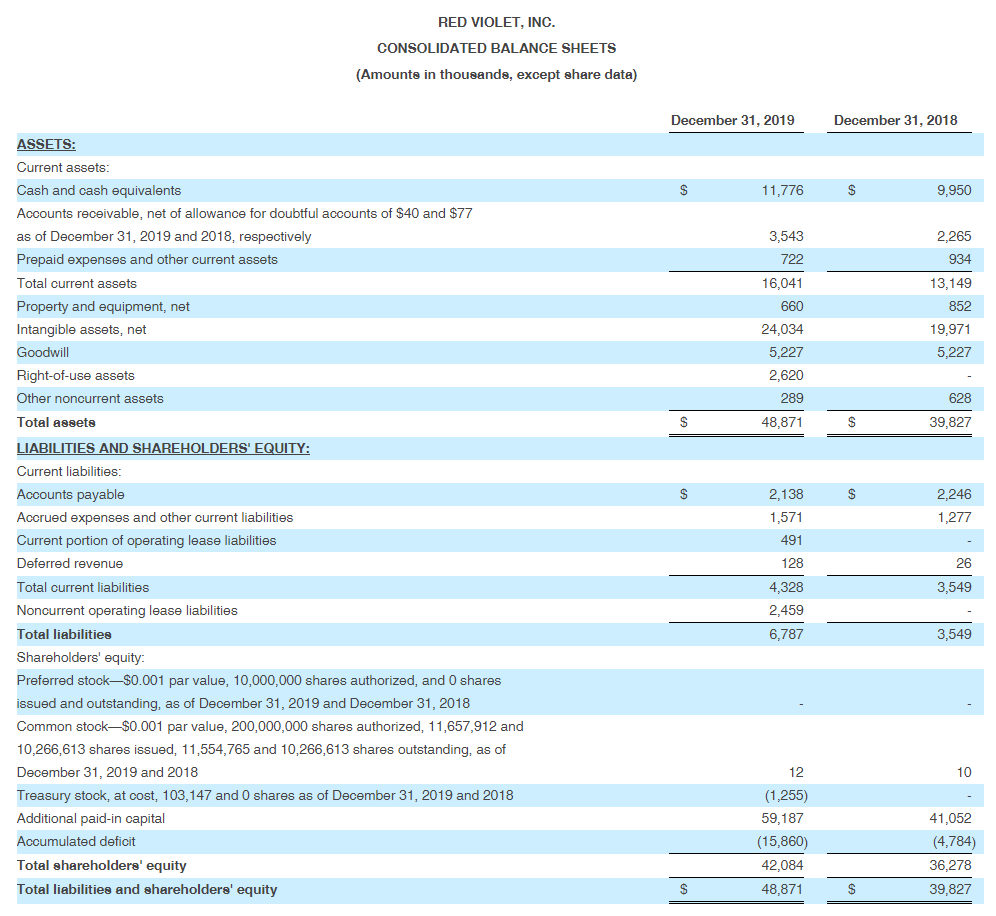
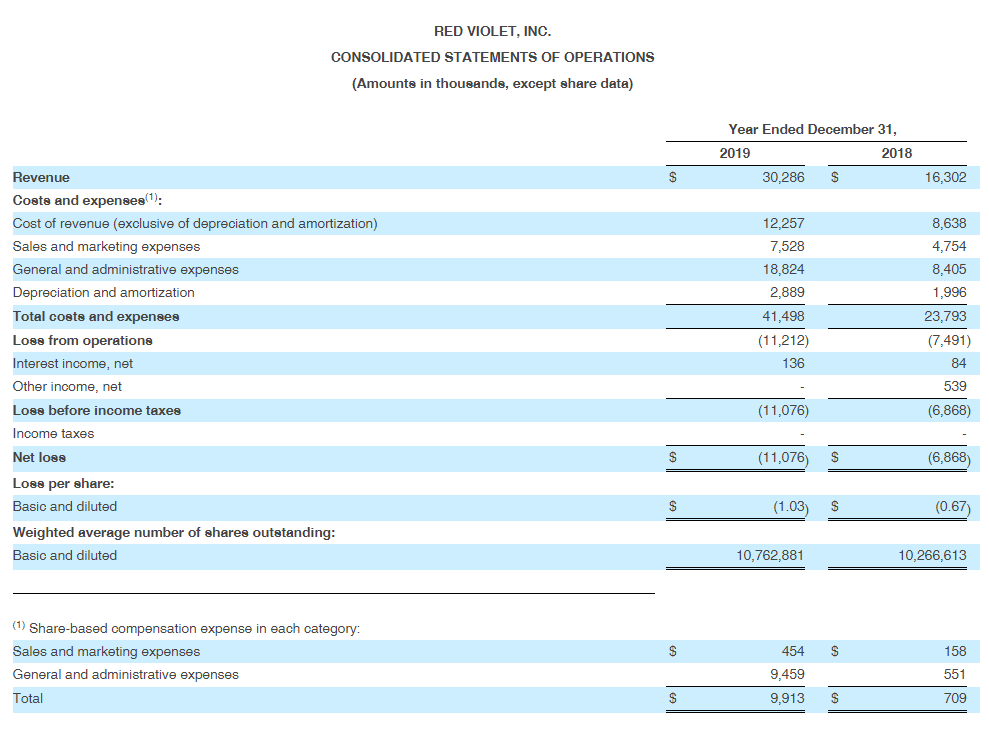
- Total revenue increased 86% to $30.3 million.
- Net loss was $11.1 million (including share-based compensation expense of $9.9 million) as compared to $6.9 million (including share-based compensation expense of $0.7 million).
- Adjusted EBITDA was $1.9 million as compared to a negative $4.3 million.
- Gross profit increased 159% to $15.4 million. Gross margin increased to 51% from 36%.
- Adjusted gross profit increased 135% to $18.0 million. Adjusted gross margin increased to 60% from 47%.
Fourth Quarter and Recent Business Highlights
- Leveraging the power of CORE™, red violet’s cloud-based, next-generation technology platform, idiCORE delivered over 280 new customers in the fourth quarter.
- Recognized as a leading innovative technology in the real estate industry, our subscription app-based solution, FOREWARN, added over 6,700 users in the fourth quarter.
- Announced partnership with our first statewide MLS, Maine Listings, and our first statewide association, Connecticut REALTORS®, to provide FOREWARN as a proactive safety and identity verification tool to their members.
- Strong revenue growth from existing customer expansion. Growth revenue from existing customers grew 177% over the fourth quarter of the prior year.
Use of Non-GAAP Financial Measures
Management evaluates the financial performance of our business on a variety of key indicators, including non-GAAP metrics of adjusted EBITDA, adjusted gross profit and adjusted gross margin. Adjusted EBITDA is a financial measure equal to net loss, the most directly comparable financial measure based on US GAAP, excluding interest income, net, depreciation and amortization, share-based compensation expense, litigation costs, net, sales and use tax expense, insurance proceeds in relation to settled litigation, transition service income, and write-off of long-lived assets and others. We define adjusted gross profit as revenue less cost of revenue (exclusive of depreciation and amortization), and adjusted gross margin as adjusted gross profit as a percentage of revenue.
Conference Call
In conjunction with this release, red violet will host a conference call and webcast today at 4:30pm ET to discuss its quarterly results and provide a business update. To listen to the call, please dial (877) 665-6635 for domestic callers or (602) 563-8608 for international callers, using the passcode 2095739. To access the live audio webcast, visit the Investors section of the red violet website at www.redviolet.com. Please login at least 15 minutes prior to the start of the call to ensure adequate time for any downloads that may be required. Following the completion of the conference call, a replay will be available for approximately one week by dialing (855) 859-2056 or (404) 537-3406 with the replay passcode 2095739. An archived webcast of the conference call will be available on the Investors section of the red violet website at www.redviolet.com.
About red violet®
At red violet, we believe that time is your most valuable asset. Through powerful analytics, we transform data into intelligence, in a fast and efficient manner, so that our clients can spend their time on what matters most – running their organizations with confidence. Through leading-edge, proprietary technology and a massive data repository, our analytics and information solutions harness the power of data fusion, uncovering the relevance of disparate data points and converting them into comprehensive and insightful views of people, businesses, assets and their interrelationships. We empower clients across markets and industries to better execute all aspects of their business, from managing risk, recovering debt, identifying fraud and abuse, and ensuring legislative compliance, to identifying and acquiring customers. At red violet, we are dedicated to making the world a safer place and reducing the cost of doing business. For more information, please visit www.redviolet.com.
FORWARD-LOOKING STATEMENTS
This press release contains “forward-looking statements,” as that term is defined under the Private Securities Litigation Reform Act of 1995 (PSLRA), which statements may be identified by words such as “expects,” “plans,” “projects,” “will,” “may,” “anticipate,” “believes,” “should,” “intends,” “estimates,” and other words of similar meaning. Such forward looking statements are subject to risks and uncertainties that are often difficult to predict, are beyond our control and which may cause results to differ materially from expectations, including whether our relentless focus on driving customer-centric solutions into the marketplace will continue to fuel our growth, whether adjusted EBITDA is pacing towards $2 million for the 2020 first quarter and whether we have never been better positioned for the future than we are today. Readers are cautioned not to place undue reliance on these forward-looking statements, which are based on our expectations as of the date of this press release and speak only as of the date of this press release and are advised to consider the factors listed above together with the additional factors under the heading “Forward-Looking Statements” and “Risk Factors” in red violet’s Form 10-K for the year ended December 31, 2018 filed on March 7, 2019, as may be supplemented or amended by the Company’s other SEC filings, including the Form 10-K for year ended December 31, 2019 expected to be filed today. We undertake no obligation to publicly update or revise any forward-looking statement, whether as a result of new information, future events or otherwise, except as required by law.
Use and Reconciliation of Non-GAAP Financial Measures
Management evaluates the financial performance of our business on a variety of key indicators, including non-GAAP metrics of adjusted EBITDA, adjusted gross profit and adjusted gross margin. Adjusted EBITDA is a financial measure equal to net loss, the most directly comparable financial measure based on US GAAP, excluding interest income, net, depreciation and amortization, share-based compensation expense, litigation costs, net, sales and use tax expense, insurance proceeds in relation to settled litigation, transition service income, and write-off of long-lived assets and others, as noted in the tables below. We define adjusted gross profit as revenue less cost of revenue (exclusive of depreciation and amortization), and adjusted gross margin as adjusted gross profit as a percentage of revenue.
The following is a reconciliation of gross profit, the most directly comparable GAAP financial measure, to adjusted gross profit:
In order to assist readers of our consolidated financial statements in understanding the operating results that management uses to evaluate the business and for financial planning purposes, we present non-GAAP measures of adjusted EBITDA, adjusted gross profit and adjusted gross margin as supplemental measures of our operating performance. We believe they provide useful information to our investors as they eliminate the impact of certain items that we do not consider indicative of our cash operations and ongoing operating performance. In addition, we use them as an integral part of our internal reporting to measure the performance and operating strength of our business.
We believe adjusted EBITDA, adjusted gross profit and adjusted gross margin are relevant and provide useful information frequently used by securities analysts, investors and other interested parties in their evaluation of the operating performance of companies similar to ours and are indicators of the operational strength of our business. We believe adjusted EBITDA eliminates the uneven effect of considerable amounts of non-cash depreciation and amortization, share-based compensation expense and the impact of other non-recurring items, providing useful comparisons versus prior periods or forecasts. Our adjusted gross profit is a measure used by management in evaluating the business’s current operating performance by excluding the impact of prior historical costs of assets that are expensed systematically and allocated over the estimated useful lives of the assets, which may not be indicative of the current operating activity. Our adjusted gross profit is calculated by using revenue, less cost of revenue (exclusive of depreciation and amortization). We believe adjusted gross profit provides useful information to our investors by eliminating the impact of non-cash depreciation and amortization, and specifically the amortization of software developed for internal use, providing a baseline of our core operating results that allow for analyzing trends in our underlying business consistently over multiple periods. Adjusted gross margin is calculated as adjusted gross profit as a percentage of revenue.
Adjusted EBITDA, adjusted gross profit and adjusted gross margin are not intended to be performance measures that should be regarded as an alternative to, or more meaningful than, financial measures presented in accordance with GAAP. The way we measure adjusted EBITDA, adjusted gross profit and adjusted gross margin may not be comparable to similarly titled measures presented by other companies, and may not be identical to corresponding measures used in our various agreements.
SUPPLEMENTAL METRICS
The following metrics are intended as a supplement to the financial statements found in this release and other information furnished or filed with the SEC. These supplemental metrics are not necessarily derived from any underlying financial statement amounts. We believe these supplemental metrics help investors understand trends within our business and evaluate the performance of such trends quickly and effectively. In the event of discrepancies between amounts in these tables and the Company’s historical disclosures or financial statements, readers should rely on the Company’s filings with the SEC and financial statements in the Company’s most recent earnings release.
We intend to periodically review and refine the definition, methodology and appropriateness of each of these supplemental metrics. As a result, metrics are subject to removal and/or changes, and such changes could be material.
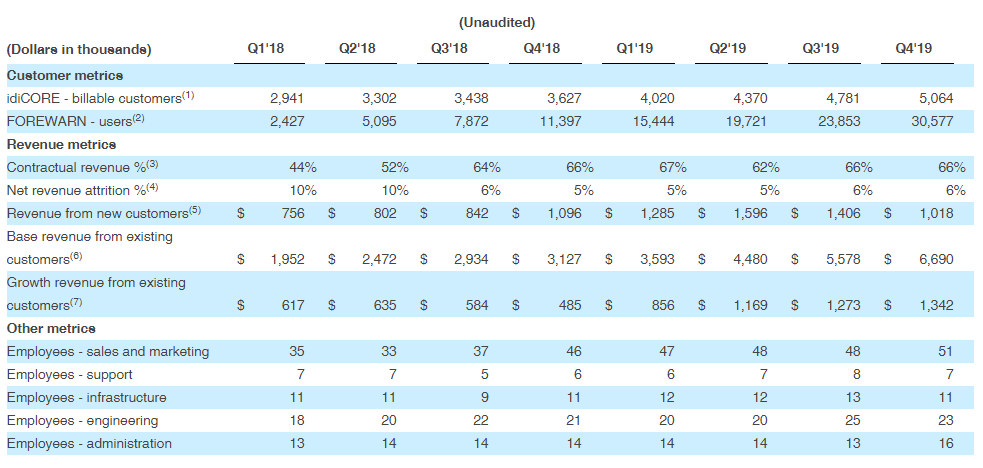
| (1) We define a billable customer of idiCORE as a single entity that generated revenue in the last month of the period. Billable customers are typically corporate organizations. In most cases, corporate organizations will have multiple users and/or departments purchasing our solutions, however, we count the entire organization as a discrete customer. |
| (2) We define a user of FOREWARN as a unique person that has a subscription to use the FOREWARN service as of the last day of the period. A unique person can only have one user account. |
| (3) Contractual revenue % represents revenue generated from customers pursuant to pricing contracts containing a monthly fee and any additional overage divided by total revenue. Pricing contracts are generally annual contracts or longer, with auto renewal. |
| (4) Net revenue attrition is defined as the revenue lost as a result of customer attrition, net of reinstated customer revenue, excluding FOREWARN revenue. Revenue is measured once a customer has generated revenue for six consecutive months. Revenue is considered lost when all revenue from a customer ceases for three consecutive months; revenue generated by a customer after the three-month loss period is defined as reinstated revenue. Net revenue attrition percentage is calculated on a trailing twelve-month basis, the numerator of which is the revenue lost during the period due to attrition, net of reinstated revenue, and the denominator of which is total revenue based on an average of total revenue at the beginning of each month during the period. |
| (5) Revenue from new customers represents the total monthly revenue generated from new customers in a given period. A customer is defined as a new customer during the first six months of revenue generation. |
| (6) Base revenue from existing customers represents the total monthly revenue generated from existing customers in a given period that does not exceed the customers’ trailing six-month average revenue. A customer is defined as an existing customer six months after their initial month of revenue. |
| (7) Growth revenue from existing customers represents the total monthly revenue generated from existing customers in a given period in excess of the customers’ trailing six-month average revenue. |
Contacts
Investor Relations Contact:
Camilo Ramirez
Red Violet, Inc.
561-757-4500
ir@redviolet.com