


red violet Announces Second Quarter 2020 Financial Results
Strong Business Model Demonstrates Resilience By Generating Record $1.8 Million in Positive Cash Flow from Operations
Business Experiencing Positive Trends Since April and Continuing Into Third Quarter
BOCA RATON, Fla., Aug. 11, 2020 (GLOBE NEWSWIRE) — Red Violet, Inc. (NASDAQ: RDVT), a leading analytics and information solutions provider, today announced financial results for the quarter ended June 30, 2020.
“red violet demonstrated the strength of its business model, generating a record $1.8 million in positive cash flow from operations despite the economic challenges of the pandemic during the quarter,” stated Derek Dubner, red violet’s CEO. “Our next-generation technology platform, mission-critical product suite, differentiated data assets, and incredible team delivered sequentially improving financial and business results from the economic trough that occurred early in the second quarter. We continue to experience improving conditions in our business and given the present economic and secular tailwinds that we expect to continue, we believe we are well-positioned for the second half of the year and throughout 2021.”
“During this unprecedented period, we implemented a multi-prong strategy to ensure the long-term success of our business — helping our customers, ensuring the health and financial well-being of our team members, gaining market share, continuing advancement in technology and products and fortifying our balance sheet. We provided temporary assistance to customers, solidifying relationships and demonstrating our commitment to their success. We did not reduce any personnel as a result of the pandemic; to the contrary, we are selectively adding to the team. Presented with the opportunity to capture market share where organizations are increasingly demanding greater efficiencies and ROI within their workflow to offset the negative impacts of the pandemic, new customer applications in June exceeded pre-pandemic levels, followed by July exceeding June by 8%.”
“Focusing on the operational leverage of our business model, we more than doubled our adjusted EBITDA on less revenue. Our high-margin platform revenue was up 11% over prior year, offsetting the decline in our services revenue by contributing more profitable dollars to the bottom line.”
“I am extremely proud of the performance of our team and the business during this unique period in time. Given our differentiated technology and data assets, our strong balance sheet, and secular tailwinds including the accelerated transformation to e-commerce and cloud adoption for increased efficiency and scale, we are extremely optimistic about our business long term.”
Second Quarter Financial Results
For the three months ended June 30, 2020 as compared to the three months ended June 30, 2019:
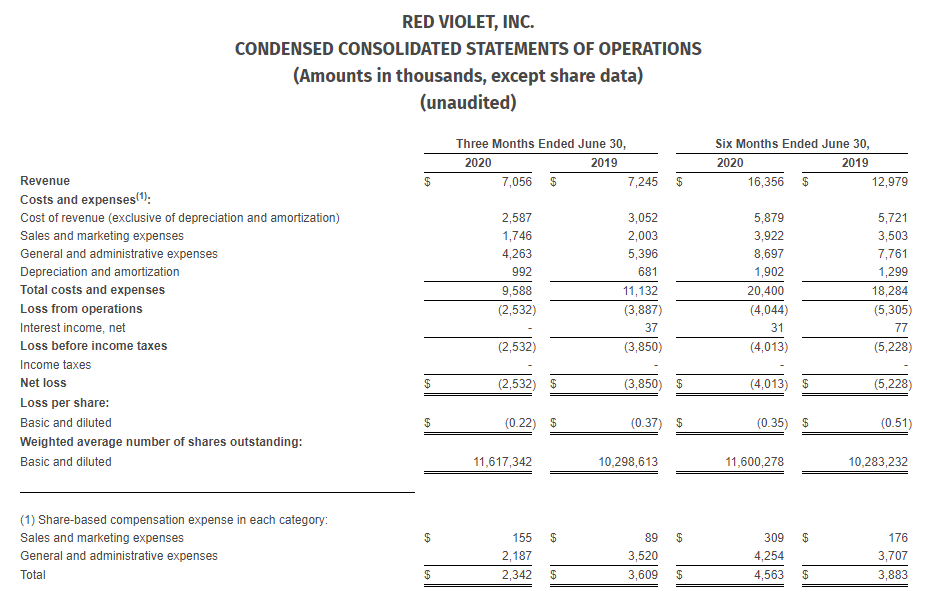
- Total revenue decreased 3% to $7.1 million. Platform revenue increased 11% to $6.9 million. Services revenue decreased 82% to $0.2 million.
- Net loss narrowed 34% to $2.5 million.
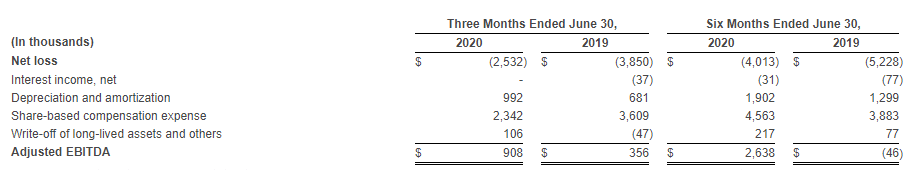
- Adjusted EBITDA increased 155% to $0.9 million.
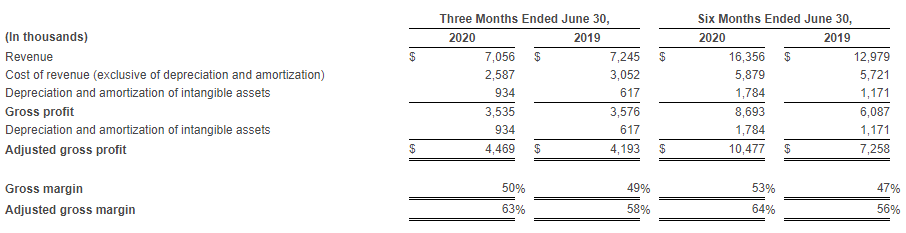
- Gross profit decreased 1% to $3.5 million. Gross margin increased to 50% from 49%.
- Adjusted gross profit increased 7% to $4.5 million. Adjusted gross margin increased to 63% from 58%.
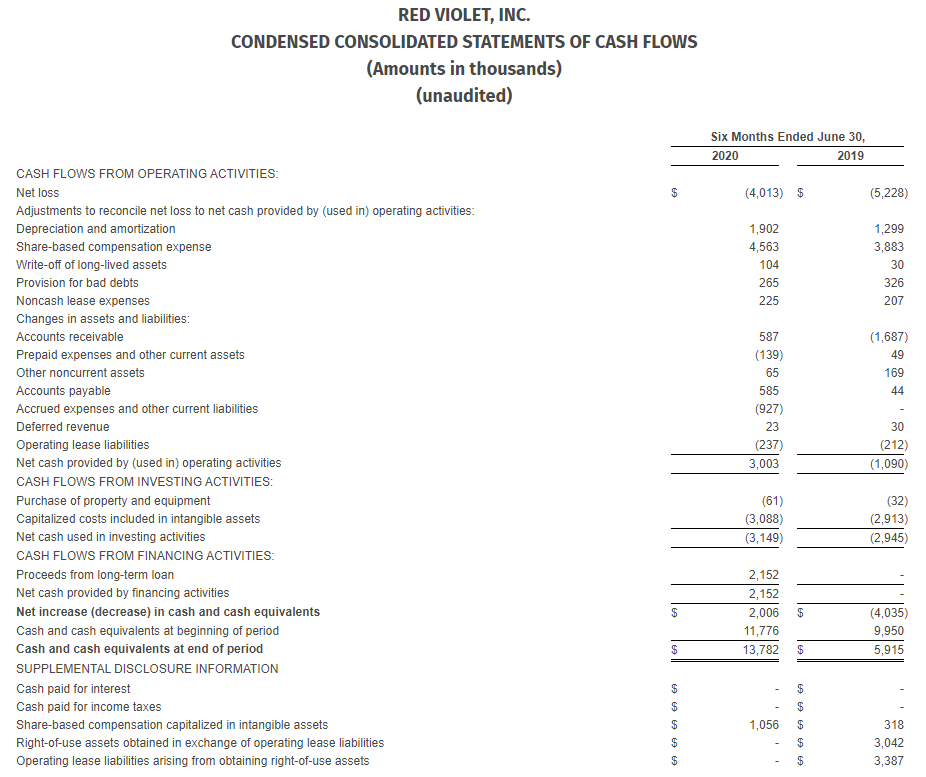
- Generated $1.8 million in cash from operating activities in the second quarter.
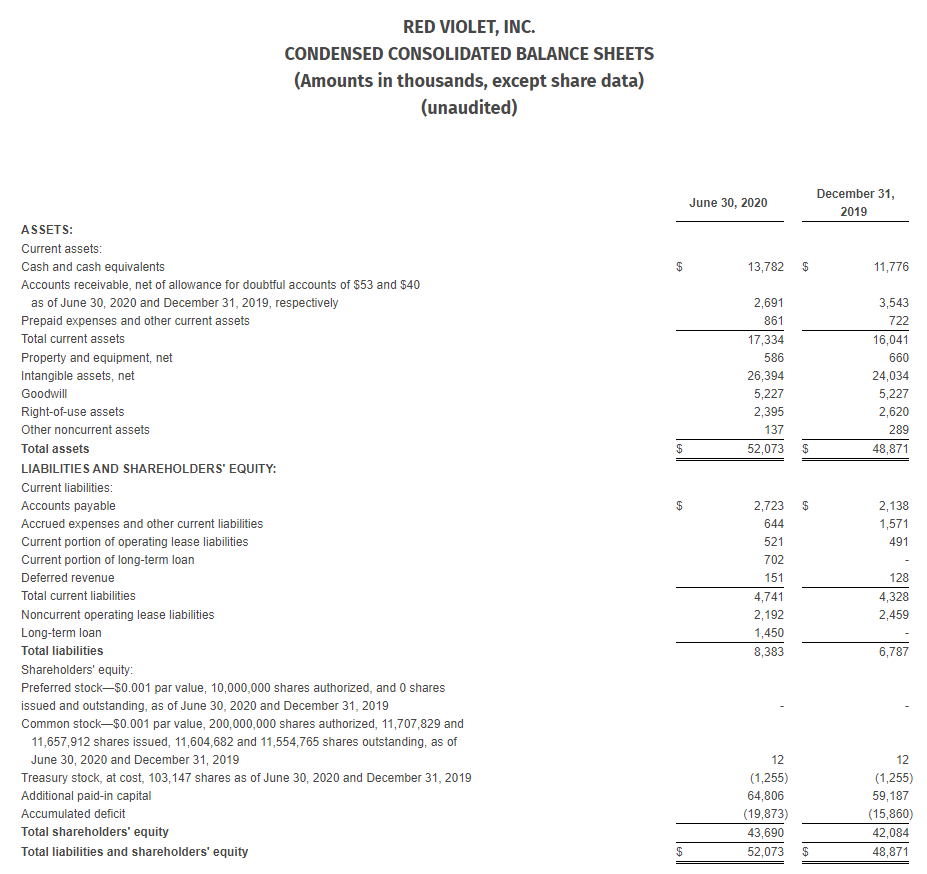
- Cash and cash equivalents were $13.8 million as of June 30, 2020.
Covid-19 Impact, Recovery and Opportunity
- Our high-margin, platform revenue business demonstrated strong resilience throughout the Covid-impacted period. As a result, on less revenue our adjusted EBITDA more than doubled to $0.9 million and our positive cash flow from operating activities increased $1.7 million compared to prior year.
- Business trends in the quarter have been positive since April, experiencing a 12% increase in monthly revenue for June compared to the April low. June provided our highest monthly new customer applications for the year, surpassing our pre-Covid monthly high, and up 33% compared to April low.
- The positive momentum building throughout the second quarter has continued in July with monthly revenue up 9% and new customer applications up 8% over June.
- Government actions, including stay-at-home orders, social distancing policies, and temporary collections moratoria resulted in reduced transactional volumes during the quarter. However, transactional volumes in July returned to pre-Covid levels.
- Our services revenue, comprised of our ancillary collections market offering, idiVERIFIED™, which is purely transactional and of a lower margin profile, experienced sharp volume declines in April attributed to transitory collections moratoria, forbearance programs and government stimulus. However, this offering showed signs of recovery in the quarter and into July. Given current visibility, customer feedback and the overall economic impact on consumer financial profiles, we believe we will realize pent-up demand in the back half of 2020 with strong tailwinds extending throughout 2021.
- During the quarter, we took a proactive customer-centric approach working with those impacted by the pandemic, temporarily granting requests for reductions, or eliminations where applicable, of minimum monthly contractual commitments on a month-to-month basis during the second quarter. The end date of the customers’ agreement was extended by one month for each month of the temporary concession.
- In April we provided concessions to a total of 124 customers, representing $130 thousand reduction of minimum committed spend. In May we provided concessions to a total of 123 customers, representing $129 thousand reduction of minimum committed spend. In June we provided concessions to a total of 72 customers, representing $83 thousand reduction of minimum committed spend. In July we provided concessions to a total of 20 customers, representing $42 thousand reduction of minimum committed spend.
- As our business model has proved resilient during this unprecedented time, we are well positioned within the markets we serve and with the solutions we provide to quickly return to our pre-Covid growth levels in the near-term. The pandemic has accelerated the pace of digital transformation for virtually every business, creating a confluence of micro and macro trends that will provide strong momentum for our business for years to come through growth in e-commerce, demand for cloud efficiency and scale, increased reliance on fraud mitigation solutions as greater transactions move online, the necessity of solving for data fragmentation, and the need for enhanced understanding of consumer risk and financial profiles.
Use of Non-GAAP Financial Measures
Management evaluates the financial performance of our business on a variety of key indicators, including non-GAAP metrics of adjusted EBITDA, adjusted gross profit and adjusted gross margin. Adjusted EBITDA is a financial measure equal to net loss, the most directly comparable financial measure based on GAAP, excluding interest income, net, depreciation and amortization, share-based compensation expense, and write-off of long-lived assets and others. We define adjusted gross profit as revenue less cost of revenue (exclusive of depreciation and amortization), and adjusted gross margin as adjusted gross profit as a percentage of revenue.
Conference Call
In conjunction with this release, red violet will host a conference call and webcast today at 4:30pm ET to discuss its quarterly results and provide a business update. To listen to the call, please dial (877) 665-6635 for domestic callers or (602) 563-8608 for international callers, using the passcode 1264788. To access the live audio webcast, visit the Investors section of the red violet website at www.redviolet.com. Please login at least 15 minutes prior to the start of the call to ensure adequate time for any downloads that may be required. Following the completion of the conference call, a replay will be available for approximately one week by dialing (855) 859-2056 or (404) 537-3406 with the replay passcode 1264788. An archived webcast of the conference call will be available on the Investors section of the red violet website at www.redviolet.com.
About red violet®
At red violet, we believe that time is your most valuable asset. Through powerful analytics, we transform data into intelligence, in a fast and efficient manner, so that our clients can spend their time on what matters most – running their organizations with confidence. Through leading-edge, proprietary technology and a massive data repository, our analytics and information solutions harness the power of data fusion, uncovering the relevance of disparate data points and converting them into comprehensive and insightful views of people, businesses, assets and their interrelationships. We empower clients across markets and industries to better execute all aspects of their business, from managing risk, recovering debt, identifying fraud and abuse, and ensuring legislative compliance, to identifying and acquiring customers. At red violet, we are dedicated to making the world a safer place and reducing the cost of doing business. For more information, please visit www.redviolet.com.
FORWARD-LOOKING STATEMENTS
This press release contains “forward-looking statements,” as that term is defined under the Private Securities Litigation Reform Act of 1995 (PSLRA), which statements may be identified by words such as “expects,” “plans,” “projects,” “will,” “may,” “anticipate,” “believes,” “should,” “intends,” “estimates,” and other words of similar meaning. Such forward looking statements are subject to risks and uncertainties that are often difficult to predict, are beyond our control and which may cause results to differ materially from expectations, including the impact of the Covid-19 pandemic on our current and future results of operations, whether, given the improving conditions in our business and the present economic and secular tailwinds that we expect to continue, we are well-positioned for the second half of the year and throughout 2021, whether, given our differentiated technology and data assets, our strong balance sheet, and secular tailwinds including the accelerated transformation to e-commerce and cloud adoption for increased efficiency and scale, we are extremely optimistic about our business long term, whether, given current visibility, customer feedback and the overall economic impact on consumer financial profiles, we believe we will realize pent-up demand in the back half of 2020 with strong tailwinds extending throughout 2021 for our services revenue, and whether the pandemic has accelerated the pace of digital transformation for virtually every business, creating a confluence of micro and macro trends that will provide strong momentum for our business for years to come through growth in e-commerce, demand for cloud efficiency and scale, increased reliance on fraud mitigation solutions as greater transactions move online, the necessity of solving for data fragmentation, and the need for enhanced understanding of consumer risk and financial profiles. Readers are cautioned not to place undue reliance on these forward-looking statements, which are based on our expectations as of the date of this press release and speak only as of the date of this press release and are advised to consider the factors listed above together with the additional factors under the heading “Forward-Looking Statements” and “Risk Factors” in red violet’s Form 10-K for the year ended December 31, 2019 filed on March 12, 2020, as may be supplemented or amended by the Company’s other SEC filings. We undertake no obligation to publicly update or revise any forward-looking statement, whether as a result of new information, future events or otherwise, except as required by law.
Use and Reconciliation of Non-GAAP Financial Measures
Management evaluates the financial performance of our business on a variety of key indicators, including non-GAAP metrics of adjusted EBITDA, adjusted gross profit and adjusted gross margin. Adjusted EBITDA is a financial measure equal to net loss, the most directly comparable financial measure based on GAAP, excluding interest income, net, depreciation and amortization, share-based compensation expense, and write-off of long-lived assets and others, as noted in the tables below. We define adjusted gross profit as revenue less cost of revenue (exclusive of depreciation and amortization), and adjusted gross margin as adjusted gross profit as a percentage of revenue.
The following is a reconciliation of gross profit, the most directly comparable GAAP financial measure, to adjusted gross profit:
In order to assist readers of our condensed consolidated financial statements in understanding the operating results that management uses to evaluate the business and for financial planning purposes, we present non-GAAP measures of adjusted EBITDA, adjusted gross profit and adjusted gross margin as supplemental measures of our operating performance. We believe they provide useful information to our investors as they eliminate the impact of certain items that we do not consider indicative of our cash operations and ongoing operating performance. In addition, we use them as an integral part of our internal reporting to measure the performance and operating strength of our business.
We believe adjusted EBITDA, adjusted gross profit and adjusted gross margin are relevant and provide useful information frequently used by securities analysts, investors and other interested parties in their evaluation of the operating performance of companies similar to ours and are indicators of the operational strength of our business. We believe adjusted EBITDA eliminates the uneven effect of considerable amounts of non-cash depreciation and amortization, share-based compensation expense and the impact of other non-recurring items, providing useful comparisons versus prior periods or forecasts. Our adjusted gross profit is a measure used by management in evaluating the business’s current operating performance by excluding the impact of prior historical costs of assets that are expensed systematically and allocated over the estimated useful lives of the assets, which may not be indicative of the current operating activity. Our adjusted gross profit is calculated by using revenue, less cost of revenue (exclusive of depreciation and amortization). We believe adjusted gross profit provides useful information to our investors by eliminating the impact of non-cash depreciation and amortization, and specifically the amortization of software developed for internal use, providing a baseline of our core operating results that allow for analyzing trends in our underlying business consistently over multiple periods. Adjusted gross margin is calculated as adjusted gross profit as a percentage of revenue.
Adjusted EBITDA, adjusted gross profit and adjusted gross margin are not intended to be performance measures that should be regarded as an alternative to, or more meaningful than, financial measures presented in accordance with GAAP. The way we measure adjusted EBITDA, adjusted gross profit and adjusted gross margin may not be comparable to similarly titled measures presented by other companies, and may not be identical to corresponding measures used in our various agreements.
SUPPLEMENTAL METRICS
The following metrics are intended as a supplement to the financial statements found in this release and other information furnished or filed with the SEC. These supplemental metrics are not necessarily derived from any underlying financial statement amounts. We believe these supplemental metrics help investors understand trends within our business and evaluate the performance of such trends quickly and effectively. In the event of discrepancies between amounts in these tables and the Company’s historical disclosures or financial statements, readers should rely on the Company’s filings with the SEC and financial statements in the Company’s most recent earnings release.
We intend to periodically review and refine the definition, methodology and appropriateness of each of these supplemental metrics. As a result, metrics are subject to removal and/or changes, and such changes could be material.
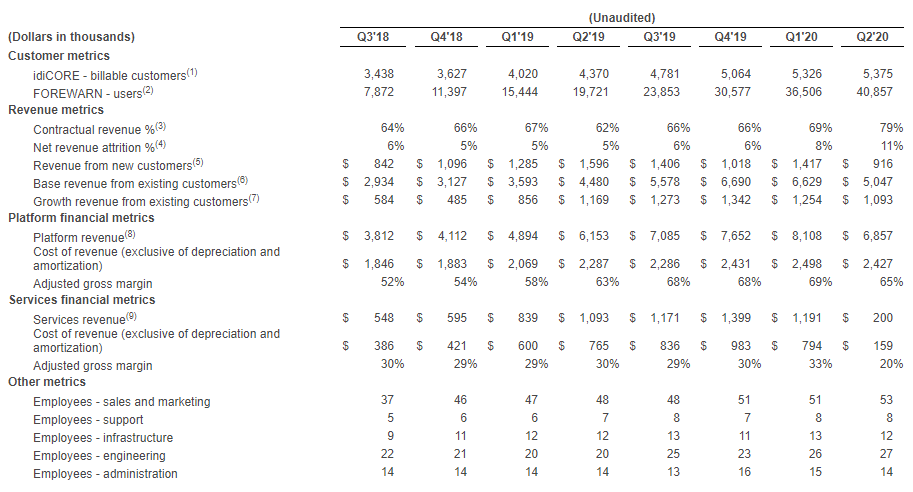
| (1) We define a billable customer of idiCORE as a single entity that generated revenue in the last month of the period. Billable customers are typically corporate organizations. In most cases, corporate organizations will have multiple users and/or departments purchasing our solutions, however, we count the entire organization as a discrete customer. |
| (2) We define a user of FOREWARN as a unique person that has a subscription to use the FOREWARN service as of the last day of the period. A unique person can only have one user account. |
| (3) Contractual revenue % represents revenue generated from customers pursuant to pricing contracts containing a monthly fee and any additional overage divided by total revenue. Pricing contracts are generally annual contracts or longer, with auto renewal. |
| (4 ) Net revenue attrition is defined as the revenue lost as a result of customer attrition, net of reinstated customer revenue, excluding FOREWARN revenue. Revenue is measured once a customer has generated revenue for six consecutive months. Revenue is considered lost when all revenue from a customer ceases for three consecutive months; revenue generated by a customer after the three-month loss period is defined as reinstated revenue. Net revenue attrition percentage is calculated on a trailing twelve-month basis, the numerator of which is the revenue lost during the period due to attrition, net of reinstated revenue, and the denominator of which is total revenue based on an average of total revenue at the beginning of each month during the period. |
| (5) Revenue from new customers represents the total monthly revenue generated from new customers in a given period. A customer is defined as a new customer during the first six months of revenue generation. |
| (6) Base revenue from existing customers represents the total monthly revenue generated from existing customers in a given period that does not exceed the customers’ trailing six-month average revenue. A customer is defined as an existing customer six months after their initial month of revenue. |
| (7) Growth revenue from existing customers represents the total monthly revenue generated from existing customers in a given period in excess of the customers’ trailing six-month average revenue. |
| (8) Platform revenue consists of both contractual and transactional revenue generated from our data fusion technology platform, CORE. It includes all revenue generated through our idiCORE and FOREWARN solutions. The cost of revenue, which consists primarily of data acquisition costs, remains relatively fixed irrespective of revenue generation. |
| (9) Services revenue consists of transactional revenue generated from our idiVERIFIED service. The cost of revenue, which consists primarily of third-party servicer costs, is variable. |
Investor Relations Contact:
Camilo Ramirez
Red Violet, Inc.
561-757-4500
ir@redviolet.com